Iudx_logo

Satellite-based Crop Health Monitoring

NDVI Data Stories

Version 3

  • Populated 6 state cards: Punjab, Uttar Pradesh, Rajasthan, Chattisgarh, Karnataka, Haryana.
  • Added reference links for each state card.
Read Story

How It Works

NDVI, or Normalized Difference Vegetation Index, works by measuring how plants interact with Red and Near-infrared (NIR) light .
Healthy, chlorophyll-rich plants absorb red light for photosynthesis and reflect NIR light efficiently.

Gauge Icon

NDVI

(NIR - RED) / (NIR + RED)

The Formula And Output

This Formula Produces A Value Ranging From -1 To +1.

-1
NON VEGETATION
0
STRESSED PLANTS
+1
HEALTHY VEGETATION

THE NDVI COLOR MAP

This is what a special camera sees when it looks at a field. Each color on the map tells a story about the plants' health.

Red Yellow: Bare Soil

Range: -1 – 0.0

Bare soil, dry areas, or non-vegetated surfaces produce very low NDVI values.

Orange: Unhealthy

Range: 0.0 – 0.2

Low NDVI values suggest vegetation is weak, unhealthy, or sparse.

Yellow-Green: Stressed

Range: 0.2 – 0.6

This value indicates plants are under stress, possibly from a lack of water or nutrients.

Dark Green: Healthy

Range: 0.6 – 1.0

A high NDVI value means the plants are healthy and full of chlorophyll.

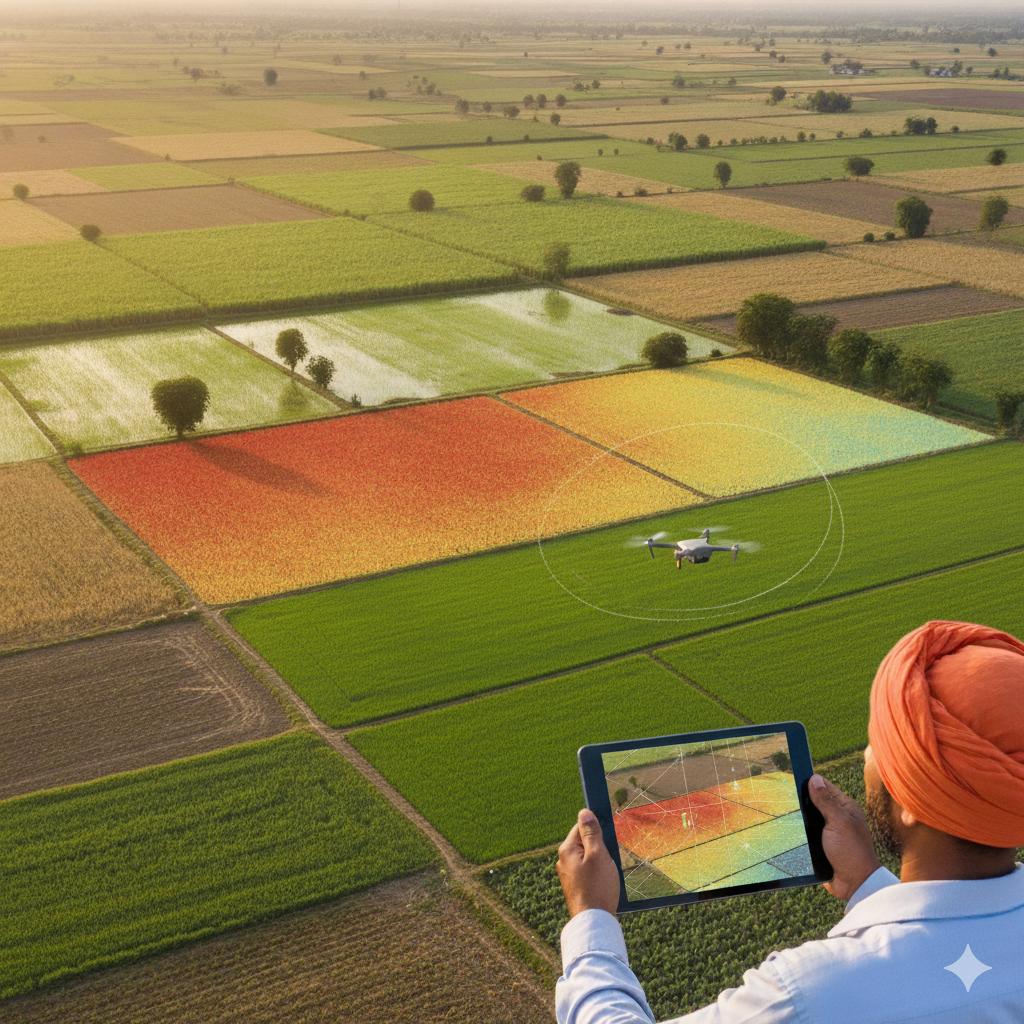
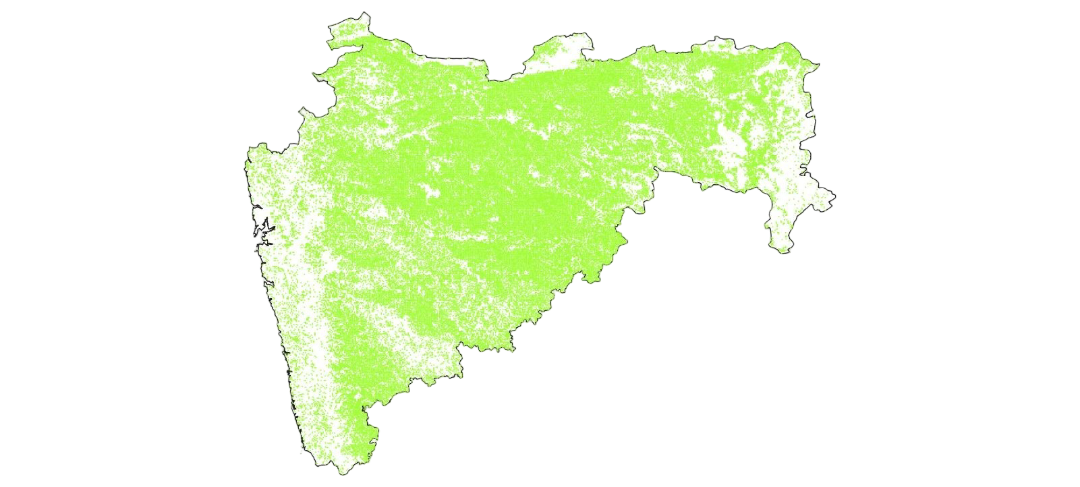
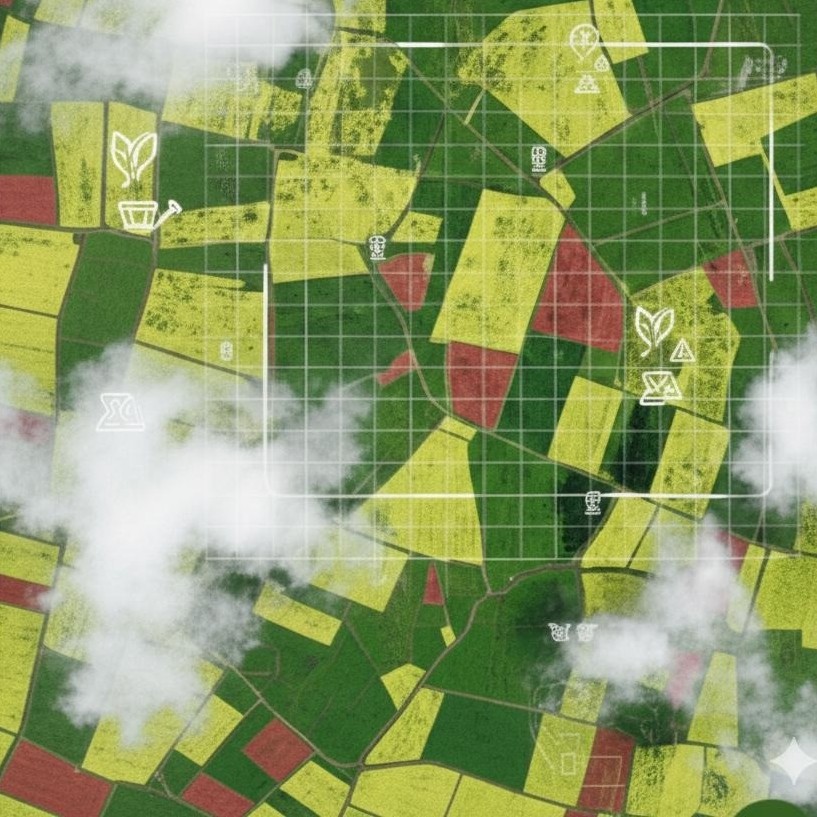
Satellite-based Crop Health Monitoring Applications

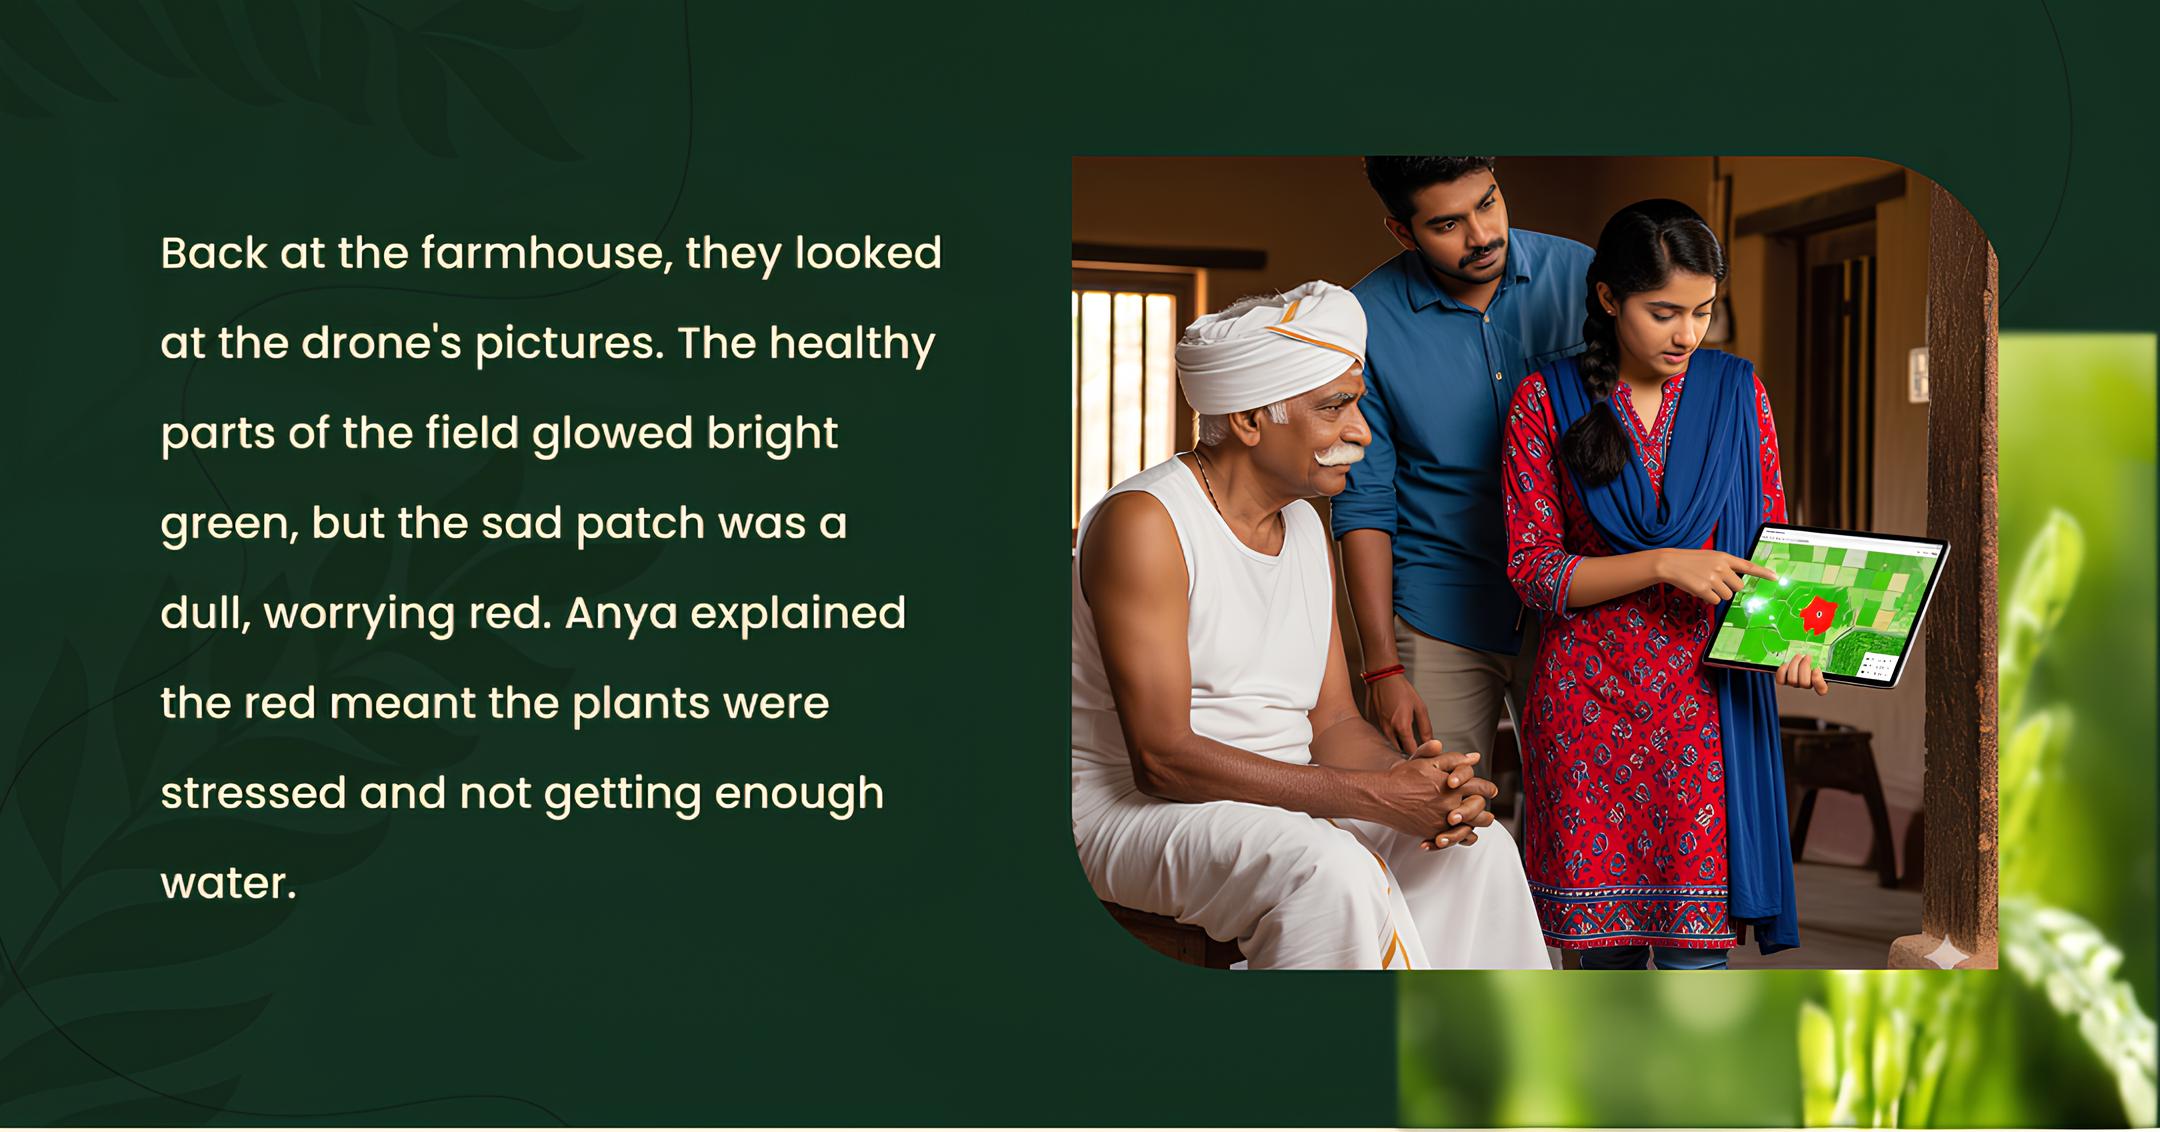
  • Early detection of nutrient deficiencies & water stress
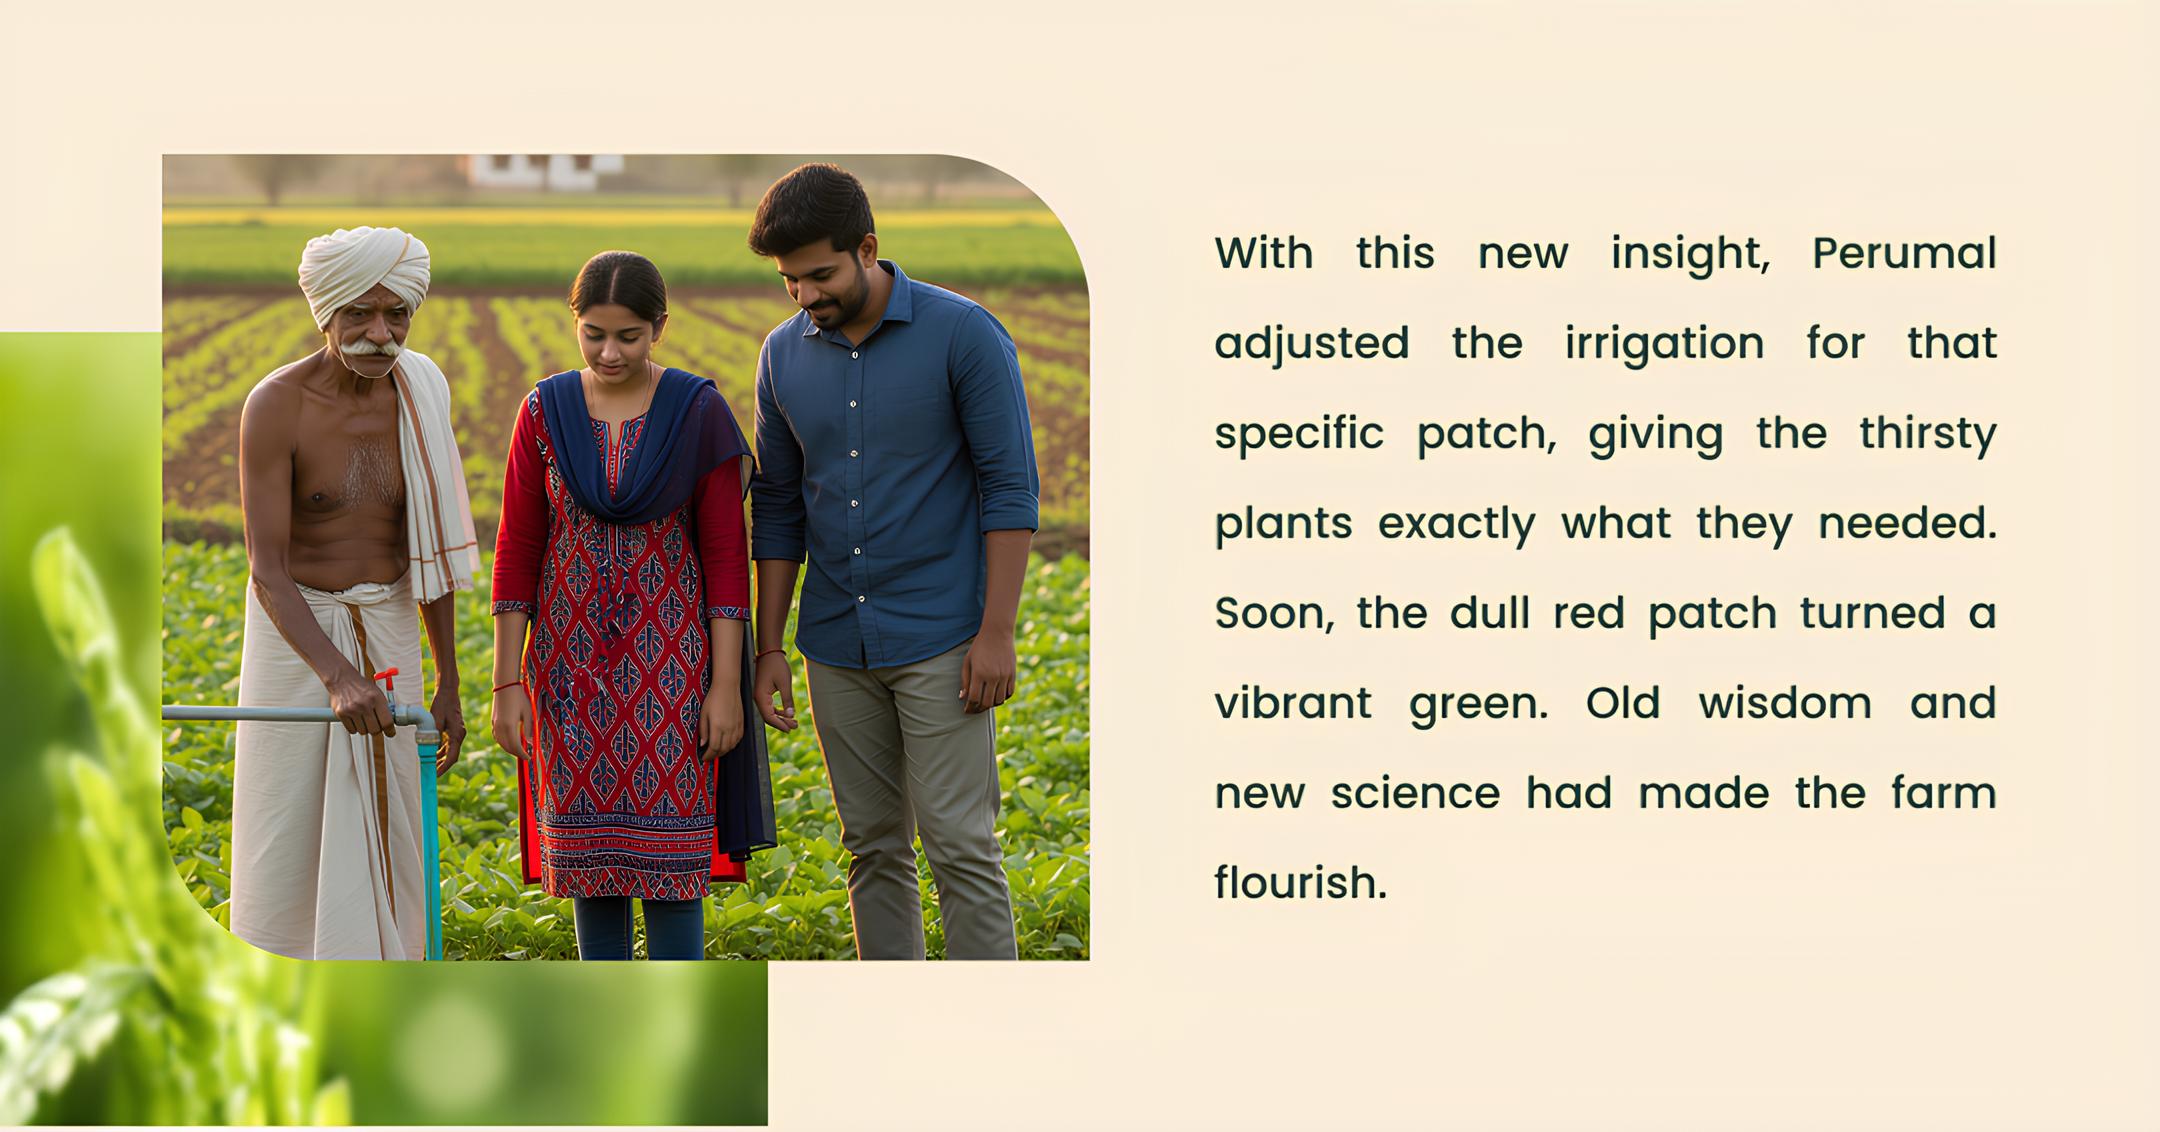
  • Precision water management
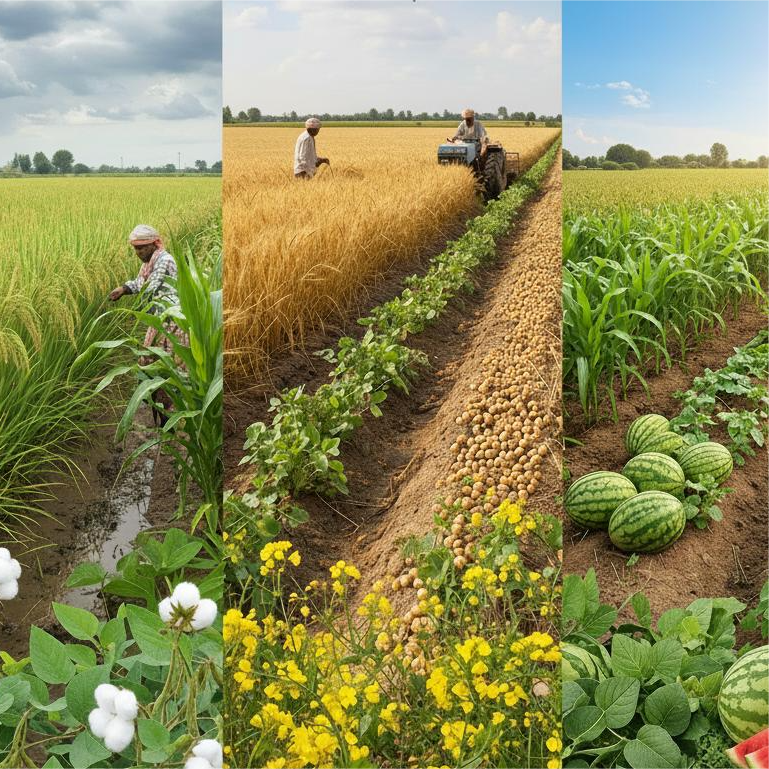
  • Pest and disease management
  • Soil Health Monitoring
  • Precision farming
    • Timely Farm Management
    • Boosting Crop Productivity
  • Irrigation Optimization

Crop Health Monitoring using NDVI in Maharashtra

02

Maharashtra

Maharashtra = India's 3rd largest state, 112 million people , and half its land under cultivation .
03

Satellite Imagery in Maharashtra

Year: 2025
1st
State
to Adopt NDVI Standards
  • Replaced traditional field surveys with satellite-based crop assessments.
  • Standardized NDVI for damage evaluation across the state.

Maharashtra Crop Season

Kharif Rabi Summer
Jun-Oct Oct-Apr Feb-Jun
Rice, Soybean, Cotton, Tur, Maize, Groundnut Wheat, Chickpea, Mustard, Rabi Jowar, Safflower Vegetables, Watermelon, Green gram, Summer Maize
05

Crop Extent in Maharashtra

Maharashtra Map
  • In 2024, nearly four-fifths (78%) of the land was suitable for cultivation.
06

Spatial Distribution of Vegetation Health

Percentage of districts falling into NDVI health categories
  • Nearly half of Maharashtra's districts show only moderate vegetation health.
07

Crop Area Allocation

Year: 2021
% of Cultivable Land under Different Crop Categories
  • Maharashtra is the second largest producer of oilseeds like soybean (28.14%) in the country.
  • While food grains dominate in area, cash crops and oilseeds contribute more to the state's economy.

NDVI Crop Health Overview – Maharashtra

  • Analysis of 16-day NDVI composites across Kharif and Rabi seasons reveals seasonal vegetation patterns and highlights periods of stress over the last decade.
  • Multi-year statistics (mean, min, max, SD) detect anomalies linked to droughts, rainfall deficits, and extreme weather, showing how climatic stresses differentially affect cropland during monsoon and post-monsoon seasons.

Mean NDVI Anomalies (Rabi & Kharif)

  • Shows overall crop health in Maharashtra (higher = healthier).
  • Dips in 2012, 2014–15, 2020–22 indicate drought stress.
10

Maximum NDVI (Healthy Vegetation)

  • High peaks (~0.98–0.99) in normal years in Maharashtra indicate healthy, dense crops.
  • Lower peaks in 2012, 2014–15, and 2020–22 in Maharashtra show stress even in top crop areas.
11

Minimum NDVI (Soil Exposure)

  • Negative dips (2012, 2013, 2020–22) in Maharashtra indicate bare soil, reflecting crop stress or failure.
  • Values near zero in normal years show minimal vegetation during off-peak periods in Maharashtra.
12
Punjab State

Punjab Story

Effectiveness & Accuracy (%)
Year: 2025
  • Agriculture → NDVI enabled precise yield estimation (97.6%) and crop mapping (85–88%), improving farming efficiency.
  • Environment → NDVI tracked vegetation loss (7.17% to urban use) and decline, aiding sustainable land management.
13
Haryana State

Haryana Story

Year: 2022
890
CCEs
Crop Cutting Experiments
88%
Accuracy
in Crop Area Estimation
  • NDVI and NDWI helped resolve insurance disputes in Bhiwani district, Haryana.
  • Satellite-based verification provided independent, reliable estimates.
  • NDVI is integrated into Pradhan Mantri Fasal Bima Yojana, India's crop insurance program.
Rajasthan State

Rajasthan Story

8%-12%
Increase
in Crop Yields
  • NDVI monitoring helped farmers identify drought-stressed areas in their fields.
  • Enabled efficient management of water and resources during dry periods.
  • Led to healthier crops and significantly higher productivity compared to conventional farming.

Uttar Pradesh Story

Year: 2021
  • NDVI was used to assess drought vulnerability
  • Boosting crop performance

Chhattisgarh Story

Year: 2024
30 yrs
Data
LANDSAT Satellite Imagery
High
Accuracy
Predicted via ANN
  • NDVI was used to improve wheat crop yield.
  • Forecasts Kharif crop yields in Raipur, Chhattisgarh.

Karnataka Story

Year: 2021
How NDVI Boosted Yields in Karnataka
  • Crop Yield improved upto 6%-12%
  • NDVI was used to assess drought vulnerability

AI-powered NDVI Applications

Integrating Satellite Data with IoT & Deep Learning
98.4%
Accuracy
in Crop Health Mapping
  • Modern NDVI applications leverage Artificial Intelligence for enhanced precision.
  • Deep learning models combine satellite NDVI data with IoT sensor inputs .

NDVI Applications Impact

  • The data compares different NDVI applications on yield improvement (%) and resource optimization (%).
  • It also includes complexity and sustainability levels for each application to assess practicality and impact.

Conclusion

NDVI (Normalized Difference Vegetation Index) is a powerful tool for monitoring crop health. By analyzing NDVI data, we can identify areas of drought stress, nutrient deficiency, or pest damage long before they become visible in the field. The patterns and anomalies detected in NDVI maps closely correspond to actual reductions in crop yield and areas affected by adverse weather, demonstrating its effectiveness in guiding timely agricultural decisions. In practice, NDVI empowers farmers, agronomists, and policymakers to implement precision interventions, optimize resource use, and mitigate losses, making it a real-world game-changer in agriculture.

21